
SAT Math : How to graph an inequality with a number line
Study concepts, example questions & explanations for SAT Math


All SAT Math Resources
Example Questions
Example Question #1 :How To Graph An Inequality With A Number Line
On a real number line, x1= -4 and x2= 14. What is the distance between these two points?
4
18
10
-18
18
The distance between two points is always positive. We calculate lx2- x1l, which will give us the distance between the points.
|14- (-4)| = |14+4| = |18| = 18
Example Question #3 :How To Graph An Inequality With A Number Line

Which of the following is a graph for the values of
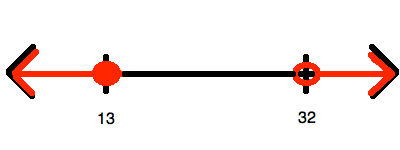
To begin, you must simplify so that you "isolate"


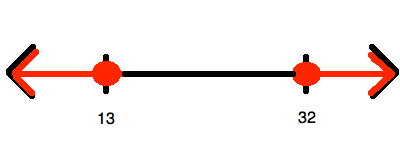
Now, this inequality represents all of the numbers between 13 and 32. However, itdoesinclude

Example Question #4 :How To Graph An Inequality With A Number Line
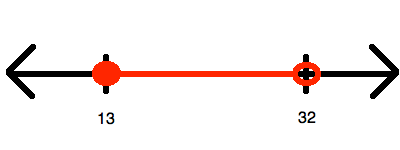
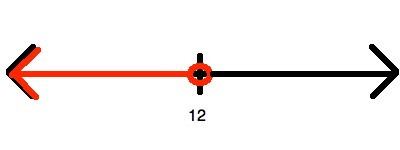
Which of the following inequalities is represented by the number line shown above?


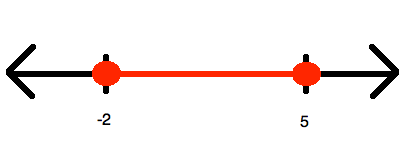
Since the inequality represents one range of values between two end points (both of which are included, given the sign being "less than or equal"), you know that whatever you answer, it must be convertible to the form:

Now, you know that it is impossible to get this out of the choices that have no absolute values involved in them. Therefore, the only options that make sense are the two having absolute values; however, here you should choose only the ones that have a
The wrong answer is simplified in this manner:


And you can stop right here, for you know you will never have
The other option is simplified in this manner:


This is just what you need!
Example Question #5 :How To Graph An Inequality With A Number Line

Which of the following is a graph for the values of
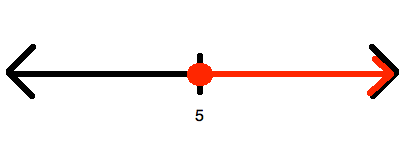

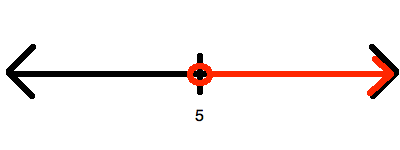
Begin by solving for


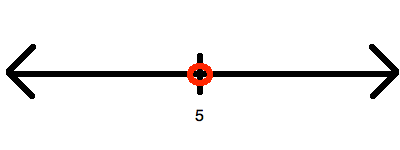
Now, this is represented by drawing an open circle at 6 and graphing upward to infinity:


All SAT Math Resources

