
AP Statistics : Mean and Linear Regression
Study concepts, example questions & explanations for AP Statistics


All AP Statistics Resources
Example Questions
Example Question #3 :Ap Statistics
A statistician conducts a regression analysis and obtains a p-value of 0.1. It is more likely than not that there is a relationship between the variables in the study.
False
True
True
A p-value of 0.1 is generally not sufficient to reject the null hypothesis, but this is only because we want a high degree of confidence before finding a relationship between variables. Here, there is most likely a relationship between the variables even though the statistician could not reject the null hypothesis.
Example Question #1 :Mean And Linear Regression
For a data set, the least-squares regression line has a
")
Based on this confidence interval, what can you do with a hypothesis test at


Reject the null hypothesis because this confidence interval does not include
Fail to reject the null hypothesis because this confidence interval does not include
Not enough information to be able to decide.
Reject the null hypothesis because this confidence interval does not include
Fail to reject the null hypothesis because this confidence interval does not include
Reject the null hypothesis because this confidence interval does not include
Notice that the interval does not include
Any confidence interval can be used to create a hypothesis test by inverting it, and it is fairly simple, but the concept is tested into graduate-level statistics theory.
Example Question #2 :Mean And Linear Regression
Which of the following is an incorrect condition requirement for regression inference?
The standard deviation of the response must be constan
Response must vary normally about the regression line for any given value of

Ordered pairs must be independent of each other
A trend/pattern of some sort in the residual plot
A linear relationship between

A trend/pattern of some sort in the residual plot
All of the following choices are correct conditions except for the choice concerning a trend/pattern of some sort in the residual plot. For regression inference to be accurate, we need to look at the residual plot of the data of interest and make sure there is random scatter. Random scatter indicates that the ordered pairs are indeed independent of each other. Any sort of pattern present in the residual plot would not satisfy that requirement, and therefore would not enable us to successfully use regression inference.
Example Question #6 :Ap Statistics
Example Question #1 :Inference
Suppose you conduct a paired


The critical value for a
Example Question #4 :Mean And Linear Regression
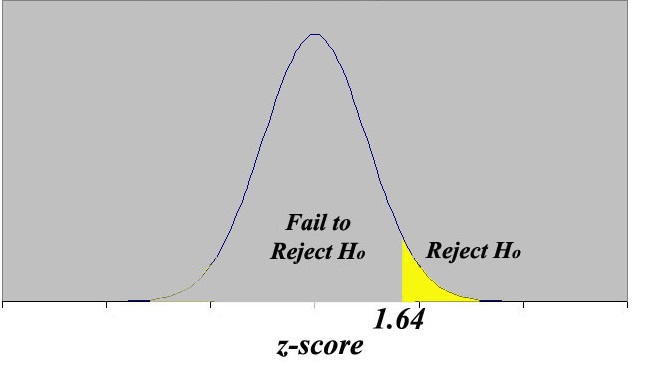
Bob wants to statistically determine if the mean height of middle school boys is greater than the mean height of middle school girls. He wants to use a significance level of


Step 1: We need to use a 2-sample z test because there are 2 samples, boys and girls. The population standard deviation,
Step 2: This is a one-sided z test because the questions asks if the mean height of boysis greaterthan the mean height of girls.


Step 3: significance level, or alpha, is


Certified Tutor

Certified Tutor

All AP Statistics Resources

