
ACT Science : How to find data representation in physics
Study concepts, example questions & explanations for ACT Science


All ACT Science Resources
Example Questions
Example Question #1 :How To Find Data Representation In Physics
Mary is performing an experiment involving the electromagnetic spectrum. She observes several different types of waves and records their wavelength, frequency, and speed.
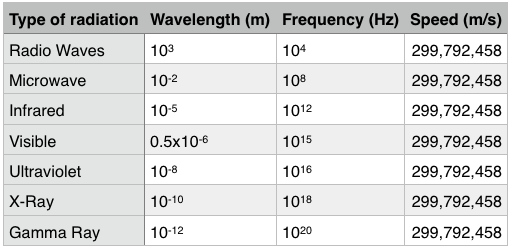
Which type of radiation has the greatest wavelength?
Gamma rays
Visible light
Radio waves
Ultraviolet light
Radio waves
The chart provides the waves in descending order of wavelength. Radio waves has a wavelength of

Example Question #2 :How To Find Data Representation In Physics
A student was interested in determining the relationship between the current, voltage, and resistance in a direct circuit, such as those exemplified by batteries connected to light bulbs. The student built the circuit presented in Figure 1 using a 2 ohm resistor.
Figure 1:
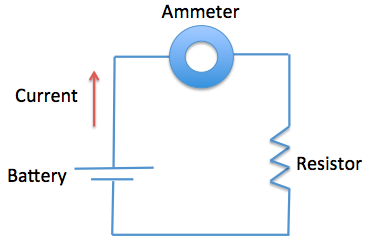
The current that flows through the circuit can be calculated using the equation


The student used a 2 ohm resistor and batteries of various voltages to obtain the results in Table 1. The currents shown in the table are NOT calculated using the formula
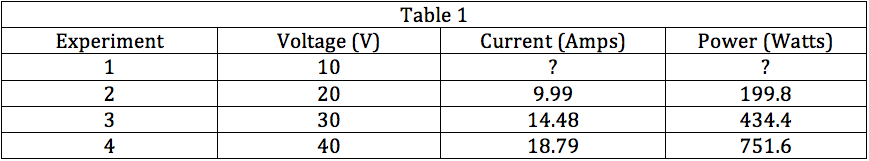
Based on the formula provided in the passage and the data from the experiments, if voltage increases, current__________.
decreases
t下降o zero
remains the same
increases
increases
Given the formula
Example Question #3 :How To Find Data Representation In Physics
A student was interested in determining the relationship between the current, voltage, and resistance in a direct circuit, such as those exemplified by batteries connected to light bulbs. The student built the circuit presented in Figure 1 using a 2 ohm resistor.
Figure 1:
The current that flows through the circuit can be calculated using the equation
The student used a 2 ohm resistor and batteries of various voltages to obtain the results in Table 1. The currents shown in the table are NOT calculated using the formula
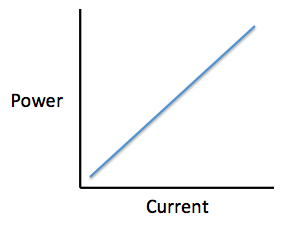
Which of the following shows a possible graphical relationship between current and voltage?
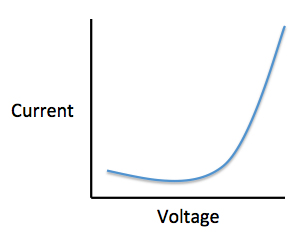
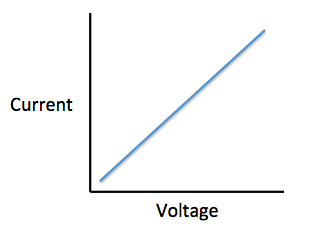
Using the formula .
.
Example Question #1 :How To Find Data Representation In Physics
A student was interested in determining the relationship between the current, voltage, and resistance in a direct circuit, such as those exemplified by batteries connected to light bulbs. The student built the circuit presented in Figure 1 using a 2 ohm resistor.
Figure 1:
The current that flows through the circuit can be calculated using the equation
The student used a 2 ohm resistor and batteries of various voltages to obtain the results in Table 1. The currents shown in the table are NOT calculated using the formula
Which of the following shows a possible graphical relationship between current and power?
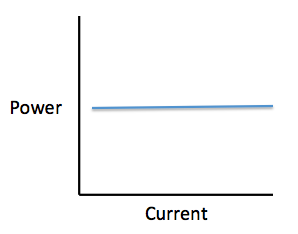
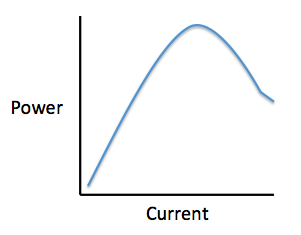
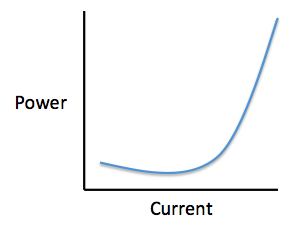
Using the formula .
.
Example Question #5 :How To Find Data Representation In Physics
A student was interested in determining the relationship between the current, voltage, and resistance in a direct circuit, such as those exemplified by batteries connected to light bulbs. The student built the circuit presented in Figure 1 using a 2 ohm resistor.
Figure 1:
The current that flows through the circuit can be calculated using the equation
The student used a 2 ohm resistor and batteries of various voltages to obtain the results in Table 1. The currents shown in the table are NOT calculated using the formula
In Experiment 1, how much current is most likely flowing through the circuit?
10 amps
12 amps
5 amps
1 amp
5 amps
The passage provides us with a formula to calculate the amount of current running through the circuit,

Example Question #6 :How To Find Data Representation In Physics
The photoelectric effect is a phenomenon that has led to many important scientific discoveries. Light of a particular wavelength is shined onto a piece of metal, showering the metal with photons. Wavelength is inversely related to a photon's energy. That is, with a smaller wavelength, the photon has greater energy. The wavelength of the light is decreased until a detector next to the metal senses that electrons are being ejected from the metal. This sensor also tells us how many electrons are ejected per second, which we call electrical current. At this point, any additional decrease in wavelength does not affect the number of electrons ejected. This point is called the metal'swork function.However, if we then begin to increase the intensity of the light being shone (meaning the amount of light as opposed to the light's wavelength), the number of electrons picked up by the sensor increases.
Which of the following graphs comparing photon energy (

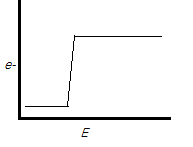
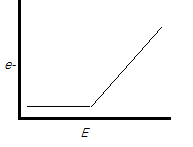
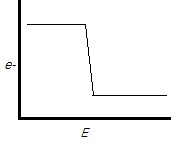
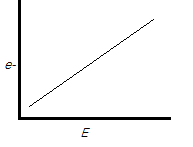
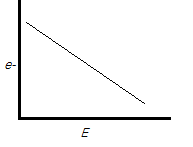
The correct answer is. As the passage says, the energy increases until suddenly the metal begins to emit a stream of electrons. At this point, as the passage states, the number of electrons does not change, explaining the plateau we see in this graph. The other graphs are not consistent with this information.
Example Question #1 :How To Find Data Representation In Physics
声波通过介质mechanicall旅行y disturbing the particles of that medium. As particles in the medium are displaced by the sound wave, they in turn act upon neighboring particles. In this fashion, the wave travels through the medium through a parallel series of disturbed particles. Like in other forms of motion, the rate at which the sound wave travels can be measured by dividing the distance over which the wave travels by the time required for it to do so.
Study 1
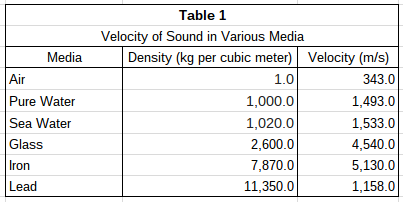
A group of students hypothesizes that the velocity of sound is dependent upon the density of the medium through which it passes. They propose that with more matter in a given space, each particle needs to travel a shorter distance to disturb the adjacent particles. Using two microphones and a high speed recording device, the students measured the delay from the first microphone to the second. They chose a variety of media, shown in Table 1, and measured the velocity of sound through each using their two-microphone setup. The results are found in Table 1.
Study 2
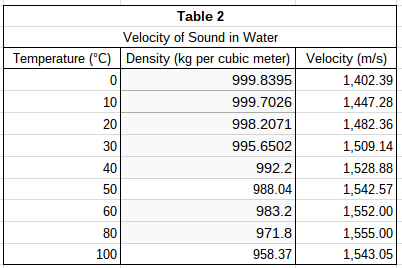
The students wanted to test their hypothesis by using the same medium at different densities. To do this, they heated pure water to various temperatures and repeated the procedure described in Study 1. Their results can be found in Table 2.
According to Study 2, over what temperature interval does velocity begin to decrease as water temperature rises?


Table 2 lists velocity of sound in its third column. As you move down the column, each value corresponds to increasing temperatures. The velocity values increase over each interval until they drop from 1,555 m/s to 1543.05 m/s. This decrease in velocity occurs between 80°C and 100°C according to the corresponding values in the first column of the table.
Example Question #201 :Physics
声波通过介质mechanicall旅行y disturbing the particles of that medium. As particles in the medium are displaced by the sound wave, they in turn act upon neighboring particles. In this fashion, the wave travels through the medium through a parallel series of disturbed particles. Like in other forms of motion, the rate at which the sound wave travels can be measured by dividing the distance over which the wave travels by the time required for it to do so.
Study 1
A group of students hypothesizes that the velocity of sound is dependent upon the density of the medium through which it passes. They propose that with more matter in a given space, each particle needs to travel a shorter distance to disturb the adjacent particles. Using two microphones and a high speed recording device, the students measured the delay from the first microphone to the second. They chose a variety of media, shown in Table 1, and measured the velocity of sound through each using their two-microphone setup. The results are found in Table 1.
Study 2
The students wanted to test their hypothesis by using the same medium at different densities. To do this, they heated pure water to various temperatures and repeated the procedure described in Study 1. Their results can be found in Table 2.
According to the data in Study 1, as density increases, what happens to the velocity of sound?
It either increases or decreases.
It increases.
It decreases.
It does not change.
It either increases or decreases.
The velocity of sound in different media is listed in the third column of Table 1. Density of the media increases as you move down the column. Velocity increases along with densityexceptbetween iron and lead. This means that no direct relationship between density and velocity can be drawn; the velocity of sound can either increase or decrease as density increases.
Example Question #1 :How To Find Data Representation In Physics
声波通过介质mechanicall旅行y disturbing the particles of that medium. As particles in the medium are displaced by the sound wave, they in turn act upon neighboring particles. In this fashion, the wave travels through the medium through a parallel series of disturbed particles. Like in other forms of motion, the rate at which the sound wave travels can be measured by dividing the distance over which the wave travels by the time required for it to do so.
Study 1
A group of students hypothesizes that the velocity of sound is dependent upon the density of the medium through which it passes. They propose that with more matter in a given space, each particle needs to travel a shorter distance to disturb the adjacent particles. Using two microphones and a high speed recording device, the students measured the delay from the first microphone to the second. They chose a variety of media, shown in Table 1, and measured the velocity of sound through each using their two-microphone setup. The results are found in Table 1.
Study 2
The students wanted to test their hypothesis by using the same medium at different densities. To do this, they heated pure water to various temperatures and repeated the procedure described in Study 1. Their results can be found in Table 2.
In Study 1, which medium tested had the greatest density?
Glass
Sea Water
Air
Lead
Iron
Lead
The densities for the media in Study 1 can be found in Table 1. In the second column of Table 1, the densities are listed in ascending order. Lead has the highest number in that column and therefore has the greatest density.
Example Question #1 :How To Find Data Representation In Physics
声波通过介质mechanicall旅行y disturbing the particles of that medium. As particles in the medium are displaced by the sound wave, they in turn act upon neighboring particles. In this fashion, the wave travels through the medium through a parallel series of disturbed particles. Like in other forms of motion, the rate at which the sound wave travels can be measured by dividing the distance over which the wave travels by the time required for it to do so.
Study 1
A group of students hypothesizes that the velocity of sound is dependent upon the density of the medium through which it passes. They propose that with more matter in a given space, each particle needs to travel a shorter distance to disturb the adjacent particles. Using two microphones and a high speed recording device, the students measured the delay from the first microphone to the second. They chose a variety of media, shown in Table 1, and measured the velocity of sound through each using their two-microphone setup. The results are found in Table 1.
Study 2
The students wanted to test their hypothesis by using the same medium at different densities. To do this, they heated pure water to various temperatures and repeated the procedure described in Study 1. Their results can be found in Table 2.
According to Study 2, water at which of the following temperatures yields the greatest velocity of sound?


Velocities of sound in water can be found in the third column of Table 2. The highest velocity listed in the table is 1,555 m/s. Temperatures are listed in the first column; this sound velocity occurs in water that is 80°C.

Certified Tutor

Certified Tutor

All ACT Science Resources

