SSAT Upper Level Math : How to interpret Venn diagrams

Study concepts, example questions & explanations for SSAT Upper Level Math

varsity tutors app store varsity tutors android store

Example Questions

Example Question #1 :How To Interpret Venn Diagrams

Venn

Examine the above Venn diagram. The universal setis defined to be, with each element placed in its correct region in the diagram. What is?

Possible Answers:

Correct answer:

Explanation:

is the complement of, the set of all elements in the universal set not in. In the diagram, it is represented by all elements not inside the circle that represents. This is the set:

Example Question #2 :How To Interpret Venn Diagrams

Venn

Examine the above Venn diagram. The universal setis defined to be, with each element placed in its correct region in the diagram. What is?

Possible Answers:

Correct answer:

Explanation:

is the union of the setsand- that is, the set of all elements ineitheror.is the complement of set- that is, the set of elements innot in;is defined similarly. Therefore, we need all of the elementseitheroutside oforoutside of. The excluded elements will be those inside both sets, which, by the diagram, can be seen to be 3, 5, 13, and 14. Therefore,

.

Example Question #1 :How To Interpret Venn Diagrams

Sets

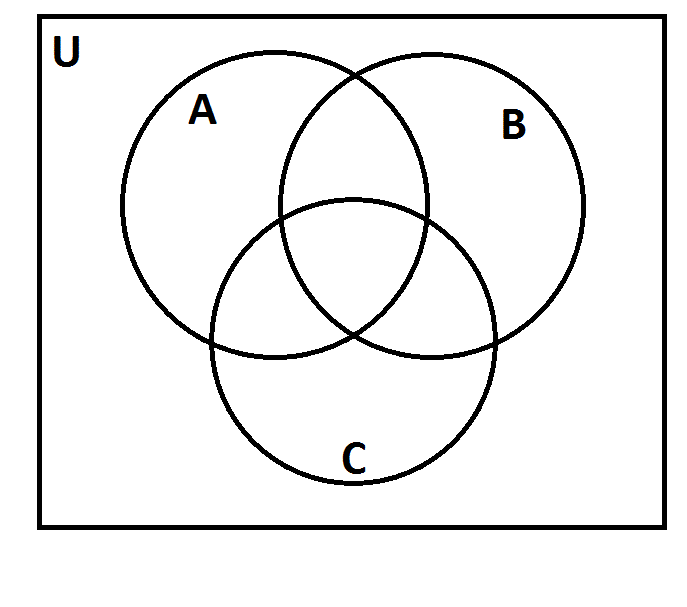
The above represents a Venn diagram. The universal setis the set of all positive integers.

Letrepresent the set of multiples of 7; letrepresent all of the multiples of 11; letrepresent all of the multiples of 13. As you can see, the three sets divide the universal set into eight regions. Suppose each positive integer was placed in the correct region. Which of the following numbers would be in the same region as 2,431?

Possible Answers:

Correct answer:

Explanation:

The region in which 2,431 appears depends on the sets of which 2,431 is an element, which in turn depends on which of 7, 11, and 13 divides it evenly:

2,431 is a multiple of 11 and 13, but not 7, so 2,431 is inand, but not. We look for a number among the choices that is inand, but not- that is, a number divisible by 11 and 13 but not 7.

, so 2,772 is divisible by 7. We can eliminate it.

, so 2,184 is divisible by 7. We can eliminate it.

, so 3,081 is not divisible by 11, and we can eliminate it.

, so 2,409 is not divisible by 13, and we can eliminate it.

However:

2,145 is divisible by 11 and 13 but not 7, so this is the correct choice.

Example Question #1 :Data Analysis / Probablility

Venn_1

The above Venn diagram represents all of this year's graduating seniors at Rockwell High School, the universal set.

represents all of the students who are in the National Honor Society.

represents all of the students who became old enough to vote in the November 5 election during their senior year.

represents all of the students who enrolled in a French course during senior year.

Cathy was inducted into the National Honor Society in her junior year, and is still a member. She turned 18 on January 4 during her senior year, and she is carrying a respectable B average in her school's third-year French course. If her name were to be written in the above diagram in the correct place, in which of the five numbered regions would her name fall?

Possible Answers:

Correct answer:

Explanation:

Cathy is in the Honor Society, meaning that she is in set; she turned 18 after election day, so she isnotin set; she is taking a French course, so she is in set. She is in set, represented by region 2.

Example Question #5 :How To Interpret Venn Diagrams
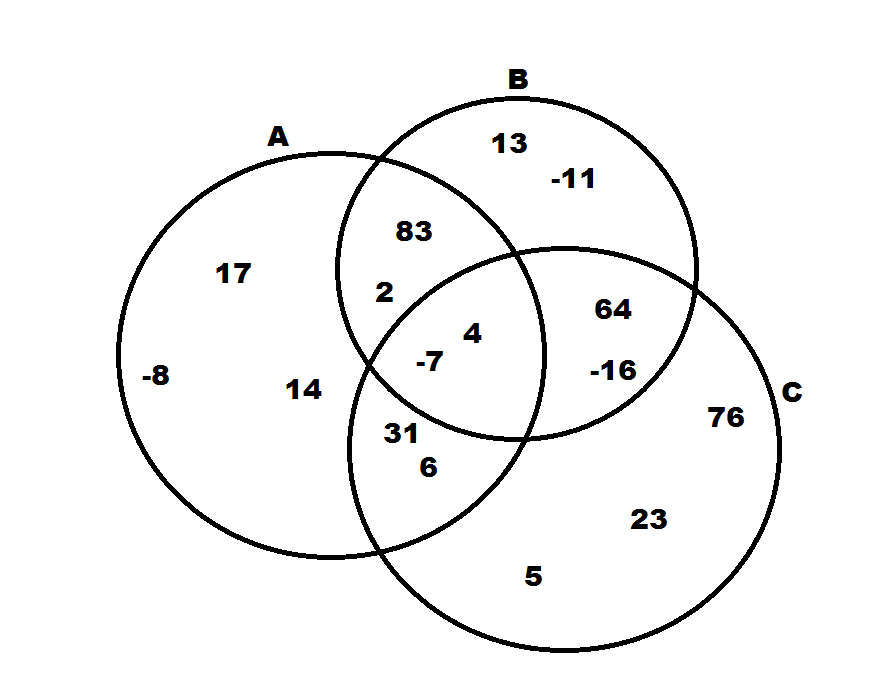
Venn_1

The universal setrepresented by the above Venn diagram is the set of all natural numbers fromtoinclusive.

The subsets are:

: The set of all multiples of

: The set of all multiples of

: The set of all multiples of

How many elements are in the set represented by the shaded region?

Possible Answers:

The correct answer is not given among the other responses.

Correct answer:

Explanation:

The shaded region is, which will comprise all of the numbers that are multiples of 10 and ofeither or both8 or 9.

will comprise multiples of 10 and 8 - that is, multiples of. Since,

will comprise multiples of 10 and 9 - that is, multiples of. Since,

To find, we first find.

, the set of numbers that are multiples of 8, 9,and10., so we look for multiples of 360, of which there are two under 1,000 (360 and 720).

Example Question #6 :How To Interpret Venn Diagrams

Venn_1

The universal setrepresented by the above Venn diagram is the set of all natural numbers from 1 to 1,000 inclusive.

The subsets are:

: The set of all multiples of

: The set of all multiples of

: The set of all multiples of

How many elements are in the set represented by the shaded region?

Possible Answers:

Correct answer:

Explanation:

The shaded region is insideand, and outside of, meaning that the shaded set represents

Examinefirst. Each number inmust be a multiple of 7 and 8; since the two are relatively prime, each number is a multiple of 56.

so seventeen elements are in.

We eliminate all elements in- that is, all elements that also multiples of 6. These elements are 168, 336, 504, 672, 840 - a total of five.

This leaves twelve elements in.

Example Question #7 :How To Interpret Venn Diagrams

Venn_1

In the above Venn diagram, the universal setis the set of Presidents of the United States.

represents the set of Presidents who were born after 1850.

represents the set of Presidents who were born in a state completely west of the Mississippi River.

represents the set of Presidents who served eight years or more.

Which of the following Presidents would fall in the pink region?

Possible Answers:

Warren G. Harding, who was born on November 2, 1865 in Ohio and died during his third year in office.

Richard M. Nixon, who was born on January 9, 1913 in California and resigned during his seventh year in office,

Abraham Lincoln, who was born on February 12, 1809 in Kentucky and was shot to death during his fifth year in office.

Woodrow Wilson, who was born on December 28, 1856 in New Jersey and served eight years in office.

Ronald Reagan, who was born on February 6, 1911 in Illinois and served eight years in office.

Correct answer:

Warren G. Harding, who was born on November 2, 1865 in Ohio and died during his third year in office.

Explanation:

The shaded region is inside set, so we are looking for a President who was born after 1850; this eliminates Lincoln.

The region is outside of, so we want a President who served fewer than eight years. This eliminates Wilson and Reagan.

The region is outside of,所以我们希望政府of the President's birth to be fully or partly east of the Mississippi River. This eliminates Nixon.

The correct response is Harding.

Example Question #1 :How To Interpret Venn Diagrams

Given the Venn diagram below, which of the following does not belong to?

13

Possible Answers:

Correct answer:

Explanation:

The symbolstands for the union between two sets. Therefore,means the set of all numbers that are in either A or B. Looking at our choices, the only number that isn't in either A, B, or both is 23.

Example Question #1 :Venn Diagrams

Venn_5

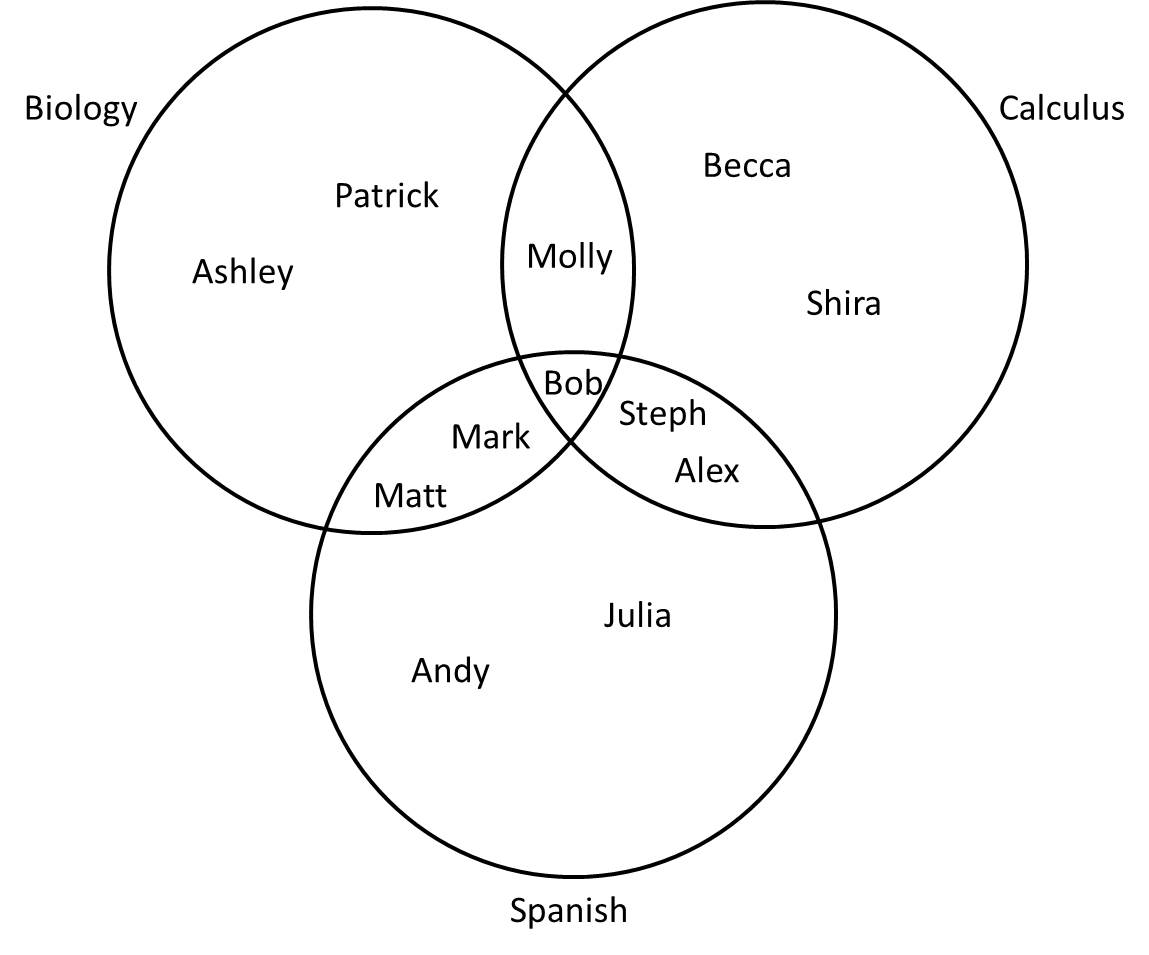
A group of high school juniors are taking Biology, Calculus, and Spanish as shown above. Which student is not in the set?

Possible Answers:

Bob

Andy

Patrick

Steph

Molly

Correct answer:

Patrick

Explanation:

The notationstands for "union," which refers to everything that is in either set.refers to the group of students taking either Calculus or Spanish (everyone on this diagram except those taking only Biology). From the diagram, Patrick and Ashley are the only students taking neither Calculus nor Spanish, so Patrick is the correct answer.

Example Question #1 :How To Interpret Venn Diagrams

Venn_3

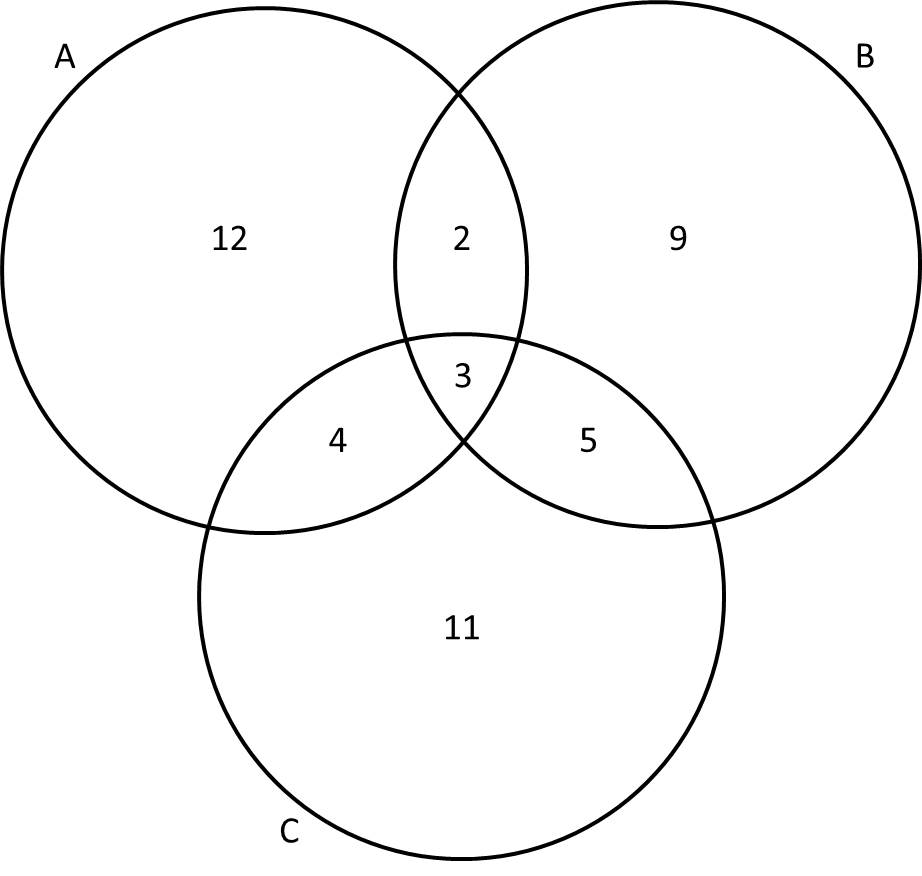
Giving the Venn diagram above, what is the sum of the numbers in the set?

Possible Answers:

Correct answer:

Explanation:

The notationstands for "A union C," which refers to everything that is in either setor set.

When we add the numbers together, we get:

Learning Tools by Varsity Tutors